Configure Xdebug for Docker
Xdebug is an extension for debugging your PHP. The following explains how to configure Xdebug and PhpStorm to debug in your local Docker environment.
If you use Microsoft Windows, take the following steps before continuing:
- Open your Docker settings.
- Select the Expose daemon on tcp://localhost:2375 without TLS checkbox.
- Wait for the settings to apply.
Enable Xdebug
To enable Xdebug for your project, add xdebug to the runtime:extensions section of the .magento.app.yaml file.
1
2
3
4
5
6
7
8
runtime:
    extensions:
        - redis
        - xsl
        - json
        - blackfire
        - newrelic
        - xdebug
Configure Xdebug
-
Rebuild the
docker-compose.ymlfile by continuing to configure your local workstation to launch the Docker environment. The following is an excerpt from thedocker-compose.ymlfile that shows Docker global variables.1 2 3 4 5 6 7 8 9
generic: image: alpine environment: - PHP_MEMORY_LIMIT=2048M - UPLOAD_MAX_FILESIZE=64M - MAGENTO_ROOT=/app - PHP_IDE_CONFIG=serverName=magento_cloud_docker - XDEBUG_CONFIG=remote_host=host.docker.internal - 'PHP_EXTENSIONS=bcmath bz2 calendar exif gd gettext intl mysqli pcntl pdo_mysql soap sockets sysvmsg sysvsem sysvshm opcache zip redis xsl xdebug'
-
Change any Xdebug configuration using the
XDEBUG_CONFIGoption. For example, to change thexdebug.remote_portoption:1
XDEBUG_CONFIG='remote_host=host.docker.internal remote_port=9002'
To configure PhpStorm to work with Xdebug:
-
In your PhpStorm project, open the settings panel.
- Mac OS X—Select File > Preferences.
- Windows/Linux—Select File > Settings.
-
In the Settings panel, expand and locate the Languages & Frameworks > PHP > Servers section.
-
Click the + to add a server configuration. The project name is in grey at the top.
-
Configure the following settings for the new server configuration:
- Name—Enter the name used for the
serverNameinPHP_IDE_CONFIGoption fromdocker-compose.ymlfile. - Host—Enter
localhost. - Port—Enter
80. - Debugger—Select
Xdebug.
- Name—Enter the name used for the
-
Select Use path mappings. In the File/Directory pane, the root of the project for the
serverNamedisplays. -
In the Absolute path on the server column, click
 and add a value to the
 MAGENTO_ROOToption. The default value is/app -
Change the Xdebug port to 9001 in the Languages & Frameworks > PHP > Debug > Xdebug > Debug Port panel.
-
Click Apply.
Use Xdebug
The following steps describe debugging web requests and CLI commands.
To debug web requests:
-
In your PhpStorm project, click
 (Start listening) in the top navigation bar.
 -
Add breakpoints in the
pub/index.phpfile. -
Install the debug extension in the browser, and then click Debug to enable.
-
In the browser, open the
https://localhostURL. -
When PhpStorm recognizes the Xdebug connection, you can begin debugging web requests.
You can debug any Magento command or PHP script using the following steps.
To debug CLI commands:
-
In your PhpStorm project, open the Build, Extension, Deployment > Docker panel, and then click
+to add a new Docker server and update the following settings:- Name—Enter a name for the server, for example
Docker Cloud. - Connect to Docker daemon with—
- Windows—Select TCP socket and update Engine Api Url with
tcp://localhost:2375. - Mac OS X—Select Docker for Mac. [default]
- Windows—Select TCP socket and update Engine Api Url with
- Name—Enter a name for the server, for example
-
In the Languages & Frameworks > PHP > Cli Interpreter panel, click […].
-
Click [+] to add and configure a new Cli Interpreter from your Docker image. Update the following settings:
- Name—Enter a name for the new interpreter, such as
Magento cloud docker cli. - Remote—Select
Docker.- Server—Select
Docker Cloudfrom the previous step. - Image name—Select
magento/magento-cloud-docker-php:7.x-cli.
- Server—Select
- Additional > Debugger extension—
- Windows—Enter
xdebug. - Mac OS X/Linux—Enter
xdebug.so.
- Windows—Enter
- Click Refresh to verify that the interpreter and Xdebug extension are configured properly.
- Name—Enter a name for the new interpreter, such as
-
Click Save.
-
Open the Run/Debug Configuration window and add a new PHP script with the following settings:
- Name—Enter
bin/magento. - Configuration > File—Select the path to the
bin/magentofile in your local environment.
- Name—Enter
-
Add breakpoints in the
bin/magentofile and the debug PHP script created in the previous step.
Using Xdebug Helper
You can install and use the Xdebug Helper Chrome extension to debug your PhP code from the browser.
To use Xdebug Helper with Chrome:
-
Install the Xdebug Helper extension from the Chrome store.
-
Enable the extension in Chrome as shown in the following figure.
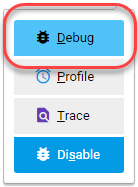
-
In Chrome, click
 in the Chrome toolbar.
 -
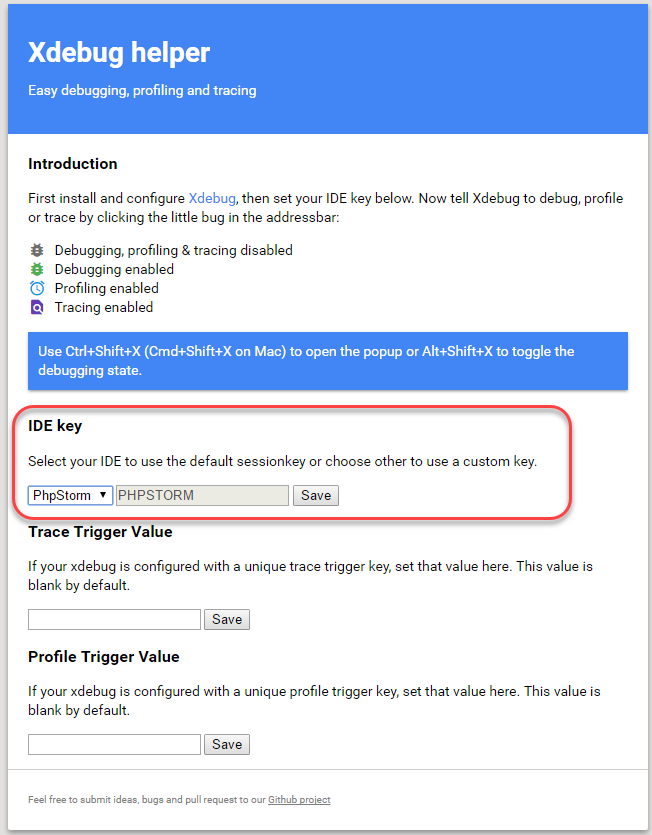
From the Xdebug helper menu, click Options.
-
From the IDE Key list, select PhpStorm.
-
Click Save.