Configure the database profiler
About the database profiler
The Magento database profiler displays all queries executed on a page, including the time for each query and what parameters were executed.
Step 1: Modify the deployment configuration
Modify <magento_root>/app/etc/env.php to add the following reference to the database profiler class:
1
2
3
4
        'profiler' => [
            'class' => '\Magento\Framework\DB\Profiler',
            'enabled' => true,
        ],
An example follows:
1
2
3
4
5
6
7
8
9
10
11
12
13
14
15
16
17
18
19
20
21
22
 'db' =>
  array (
    'table_prefix' => '',
    'connection' =>
    array (
      'default' =>
      array (
        'host' => 'localhost',
        'dbname' => 'magento',
        'username' => 'magento',
        'password' => 'magento',
        'model' => 'mysql4',
        'engine' => 'innodb',
        'initStatements' => 'SET NAMES utf8;',
        'active' => '1',
        'profiler' => [
            'class' => '\Magento\Framework\DB\Profiler',
            'enabled' => true,
        ],
      ),
    ),
  ),
Step 2: Configure the output
Configure the output in your Magento application boostrap file; this might be <magento_root>/index.php or it could be located in a web server virtual host configuration.
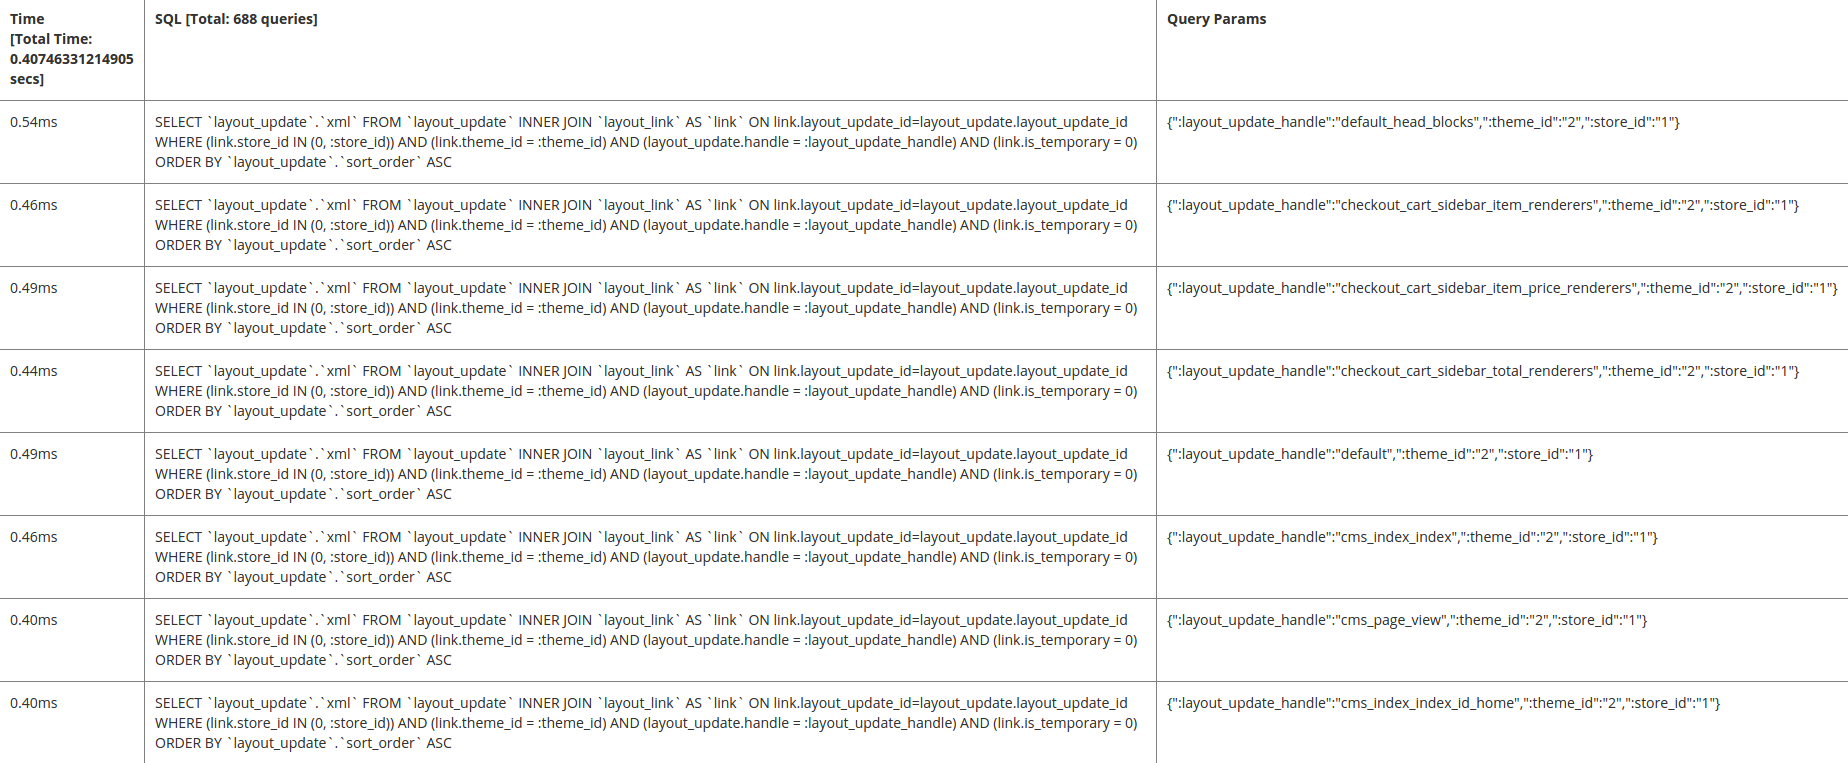
The following example displays results in a three-column table:
- Total time (displays the total amount of time to run all queries on the page)
- SQL (displays all SQL queries; the row header displays the count of queries)
- Query Params (displays the parameters for each SQL query)
To configure the output, add the following after the $bootstrap->run($app); line in your bootstrap file:
1
2
3
4
5
6
7
8
9
10
11
12
13
14
15
16
17
18
19
/** @var \Magento\Framework\App\ResourceConnection $res */
$res = \Magento\Framework\App\ObjectManager::getInstance()->get('Magento\Framework\App\ResourceConnection');
/** @var Magento\Framework\DB\Profiler $profiler */
$profiler = $res->getConnection('read')->getProfiler();
echo "<table cellpadding='0' cellspacing='0' border='1'>";
echo "<tr>";
echo "<th>Time <br/>[Total Time: ".$profiler->getTotalElapsedSecs()." secs]</th>";
echo "<th>SQL [Total: ".$profiler->getTotalNumQueries()." queries]</th>";
echo "<th>Query Params</th>";
echo "</tr>";
foreach ($profiler->getQueryProfiles() as $query) {
    /** @var Zend_Db_Profiler_Query $query*/
    echo '<tr>';
    echo '<td>', number_format(1000 * $query->getElapsedSecs(), 2), 'ms', '</td>';
    echo '<td>', $query->getQuery(), '</td>';
    echo '<td>', json_encode($query->getQueryParams()), '</td>';
    echo '</tr>';
}
echo "</table>";
Step 3: View the results
Go to any page in your storefront or Magento Admin to view the results. A sample follows: